GTS Station Tour

A guided walkthrough of the main GTS Desk screens โ€” every surface, all native, all under one chrome.

Watch Demo

Capability clips from the live workstation

Short product clips showing real GTS Desk workflows. The full demo library is also available on the Watch Demo page.

Strategy Creation ยท build a strategy from the station workflow.
Candle Expression ยท create candle-pattern signal logic visually.
Mass Strategies ยท generate many variants from one template.
History Collection ยท prepare historical data jobs.
RSI Was/Is ยท compare historical and current indicator state.
Channel Detection ยท advanced pattern capability in action.

Step 1 ยท Build

Compose the signal logic

From a single Quick-Create NLP prompt to thousands of strategy permutations โ€” three surfaces cover author-time.

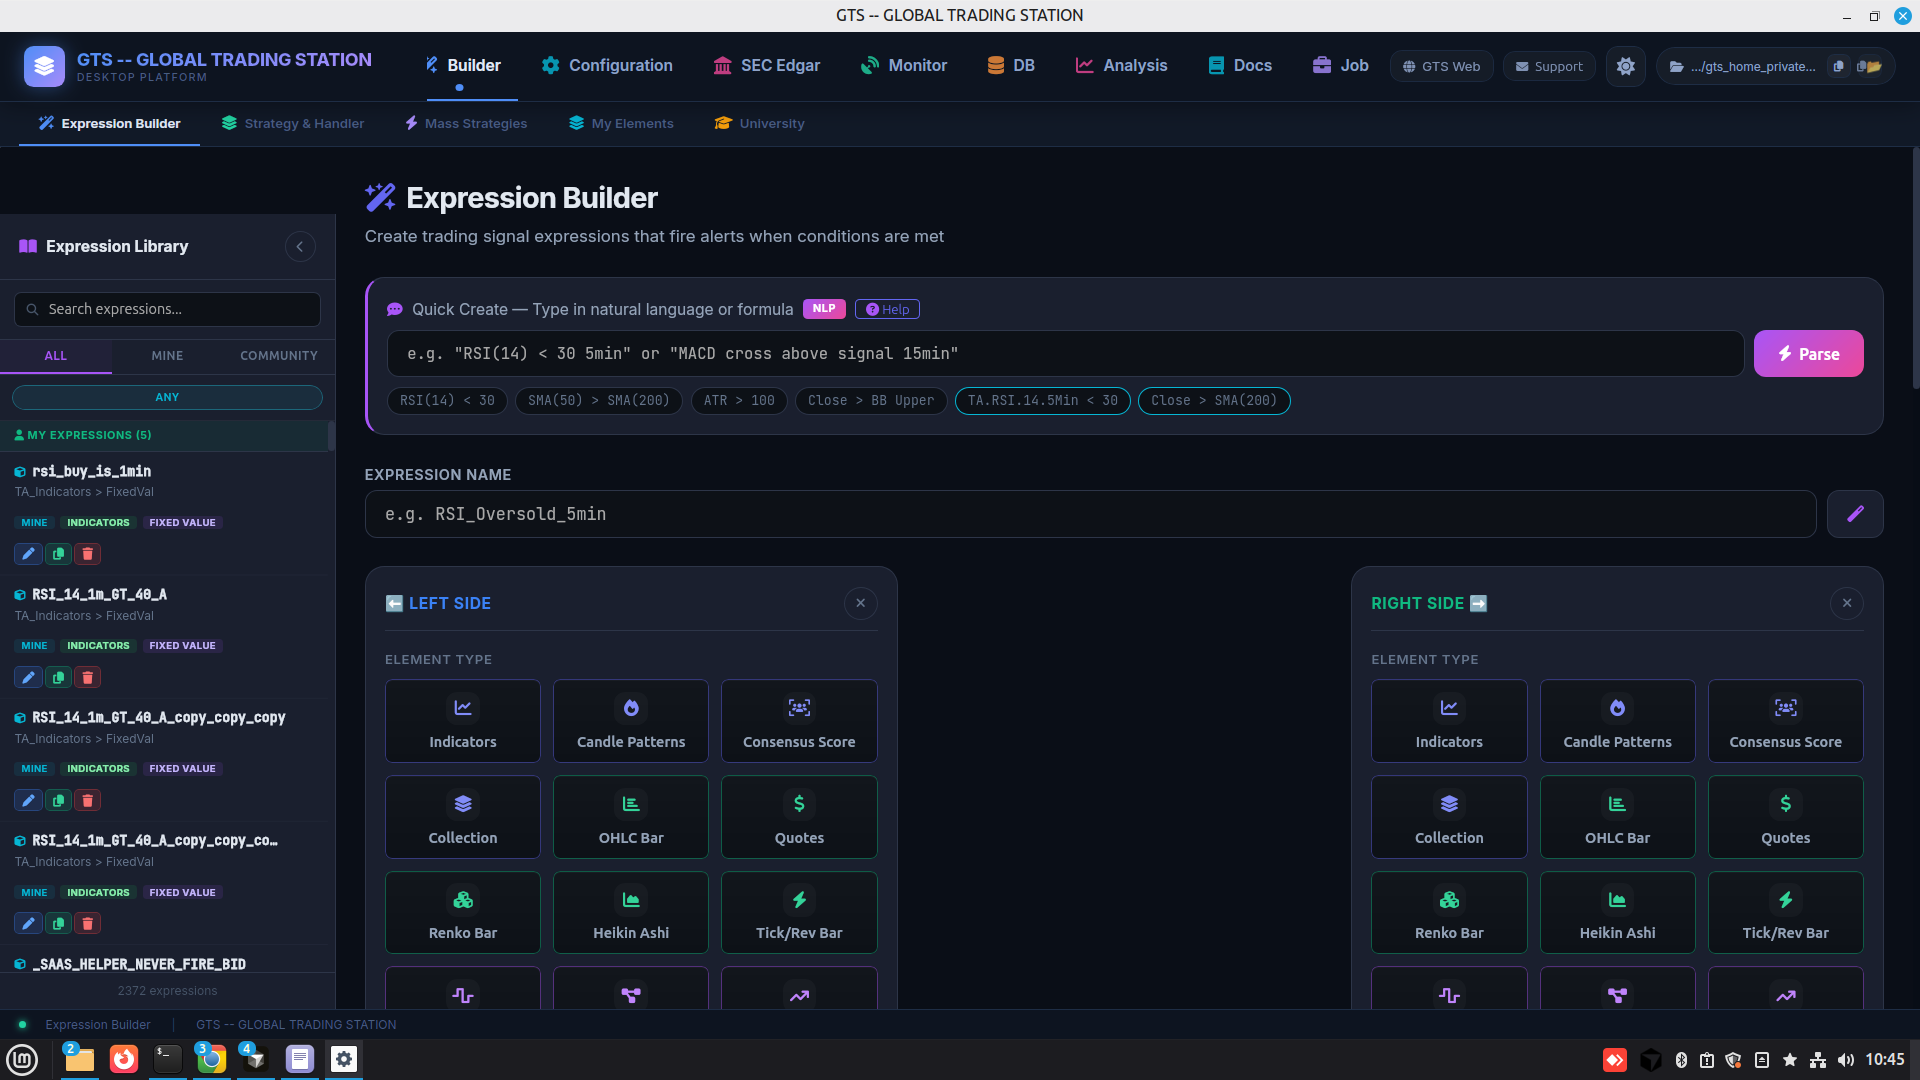
GTS Desk Expression Builder
Expression Builder ยท left/right canvas + Quick-Create NLP, framed by 8-tab station chrome.
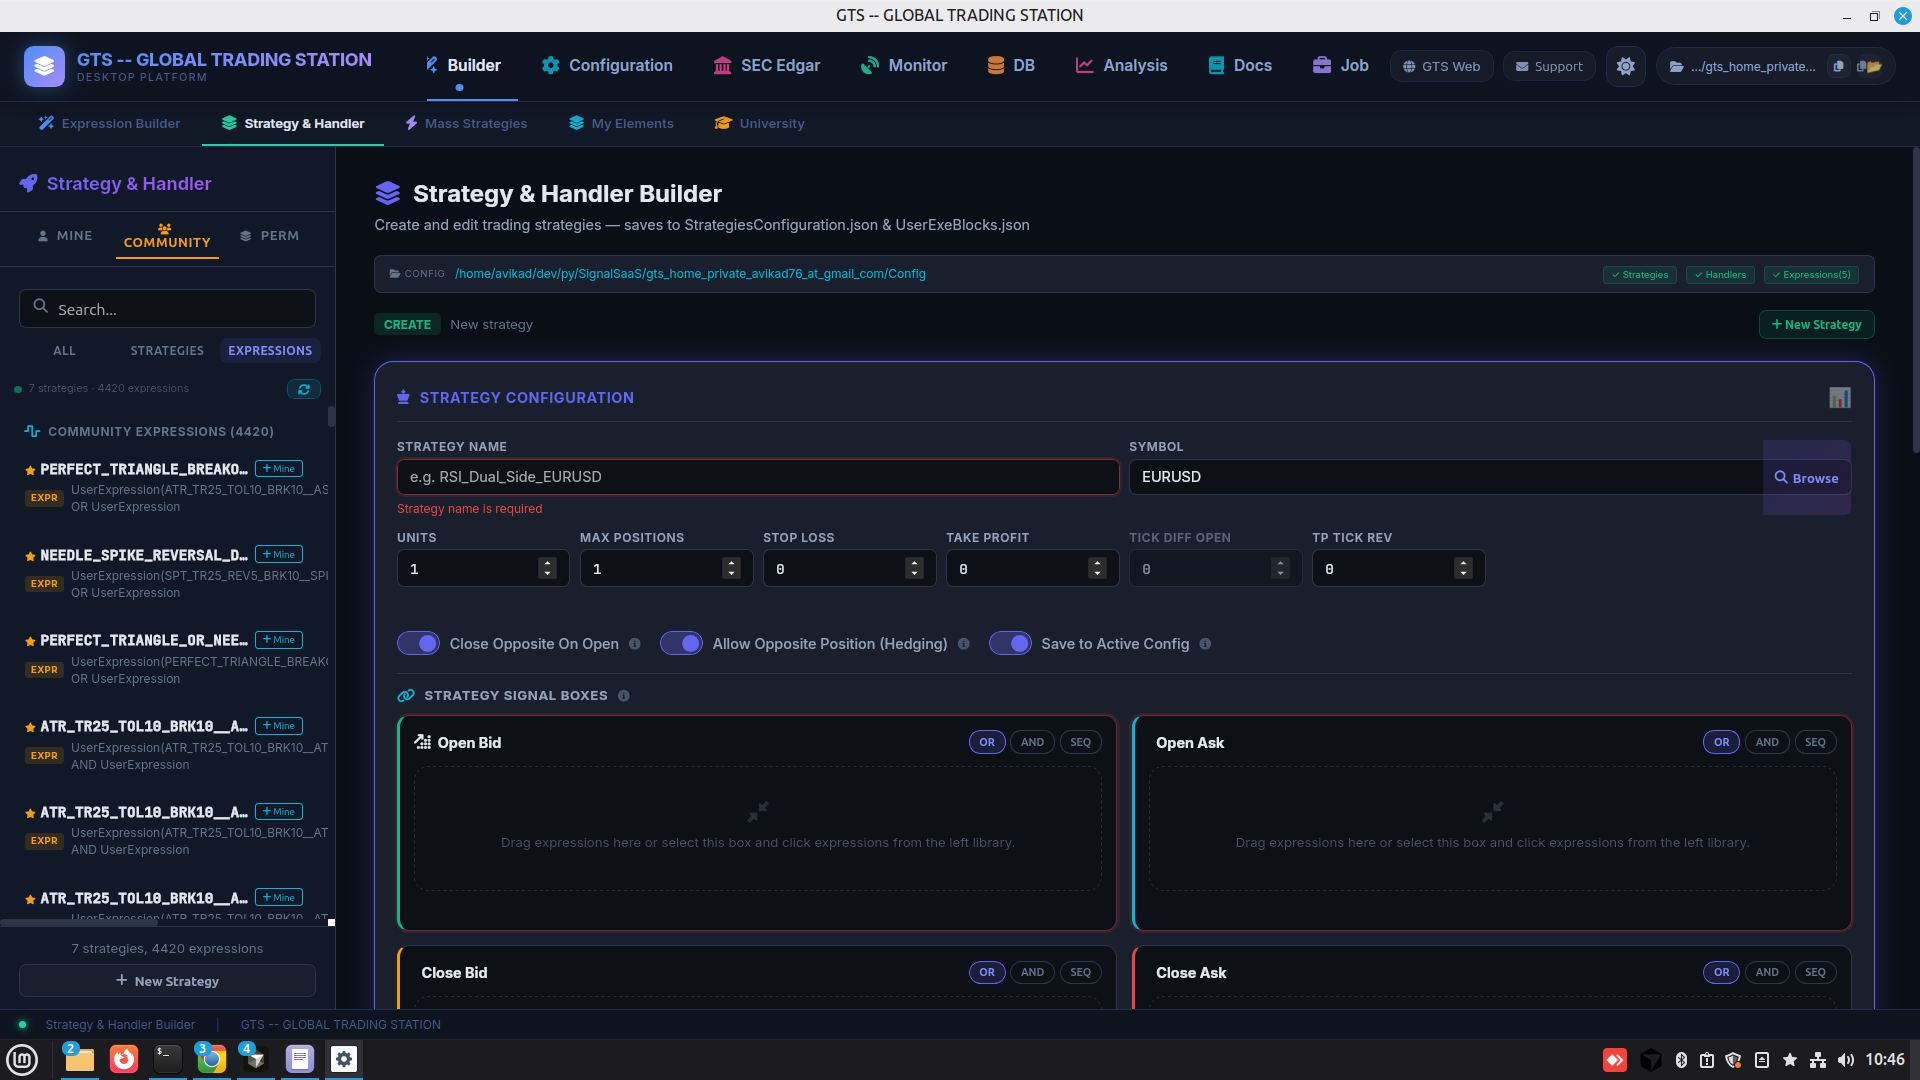
Strategy & Handler
Strategy & Handler ยท Units/SL/TP + 4 signal boxes where expressions drop in.
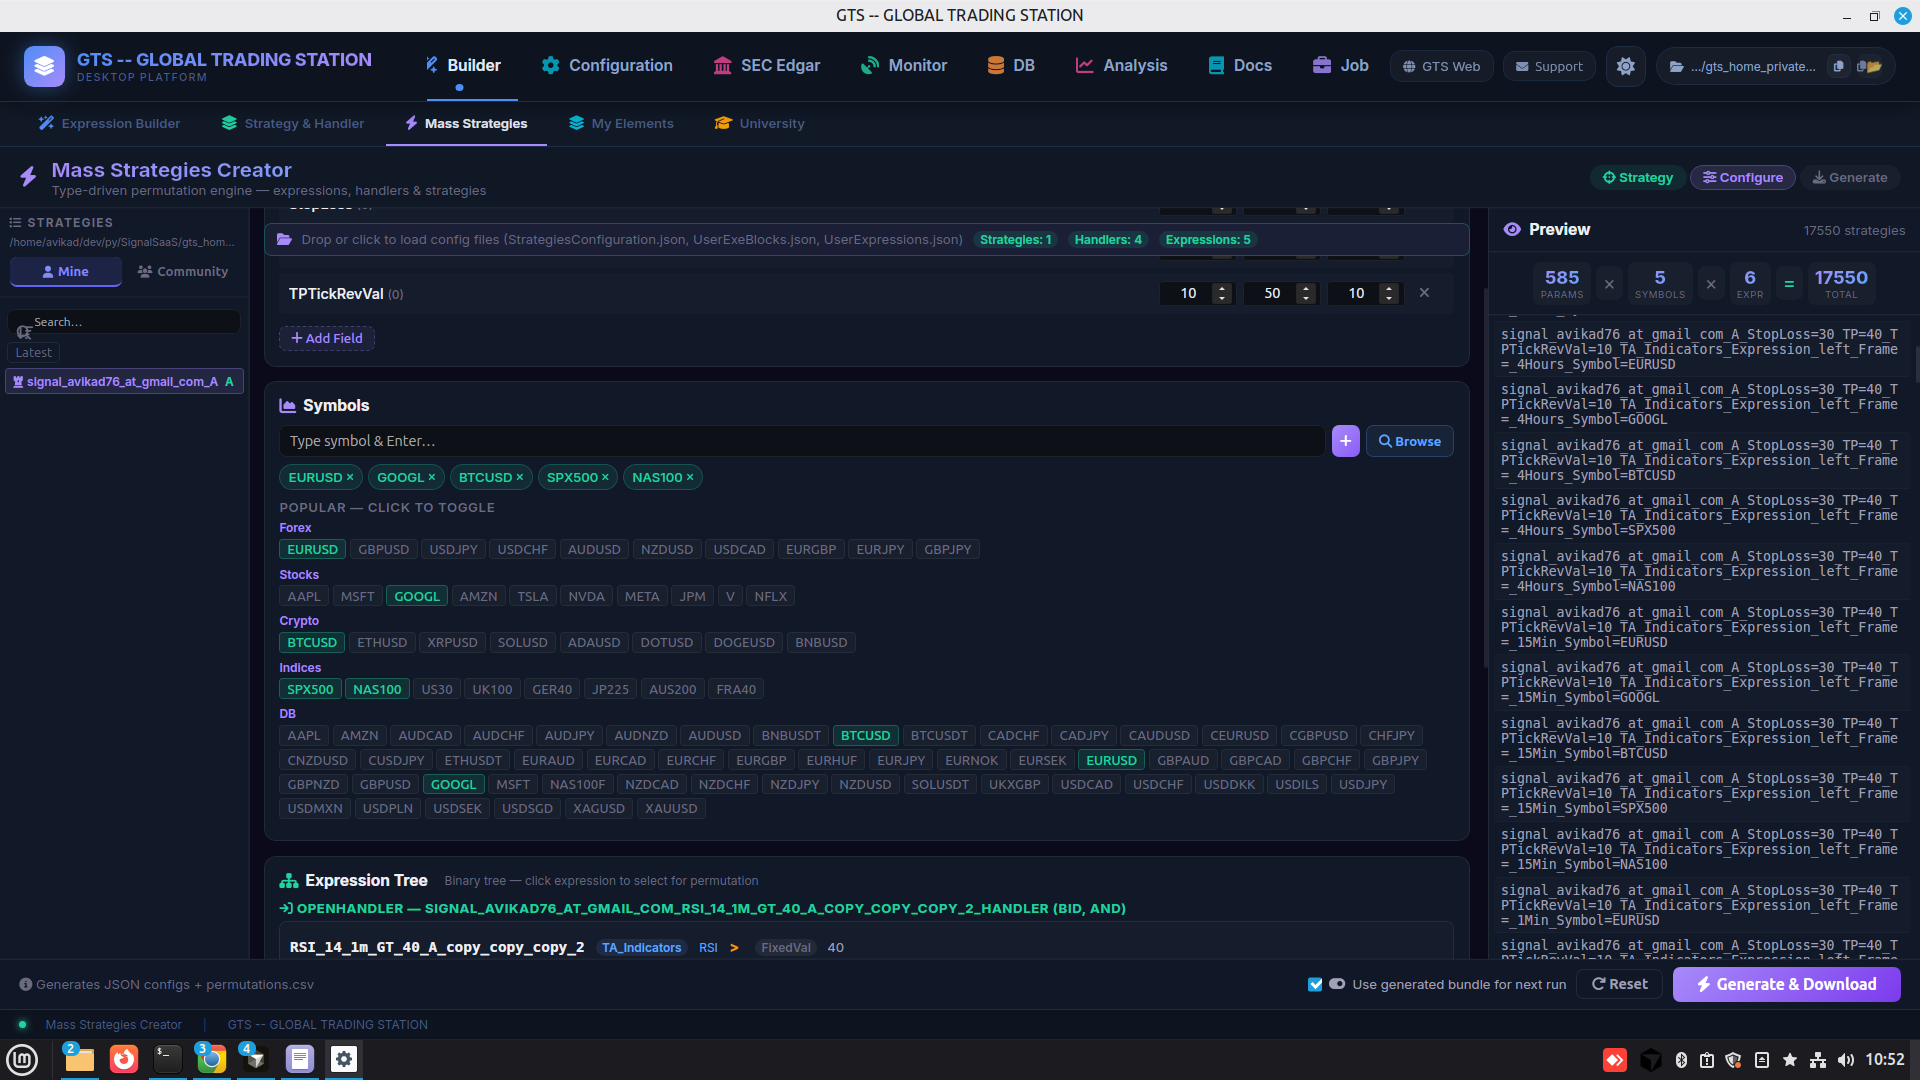
Mass Strategies
Mass Strategies ยท parameter sweeps ร— symbols generating thousands of variants from one template.

Step 2 ยท Run & manage

Operate what you built

Saved strategies become live runtime, governed by per-system params, exchange keys, and channel policy.
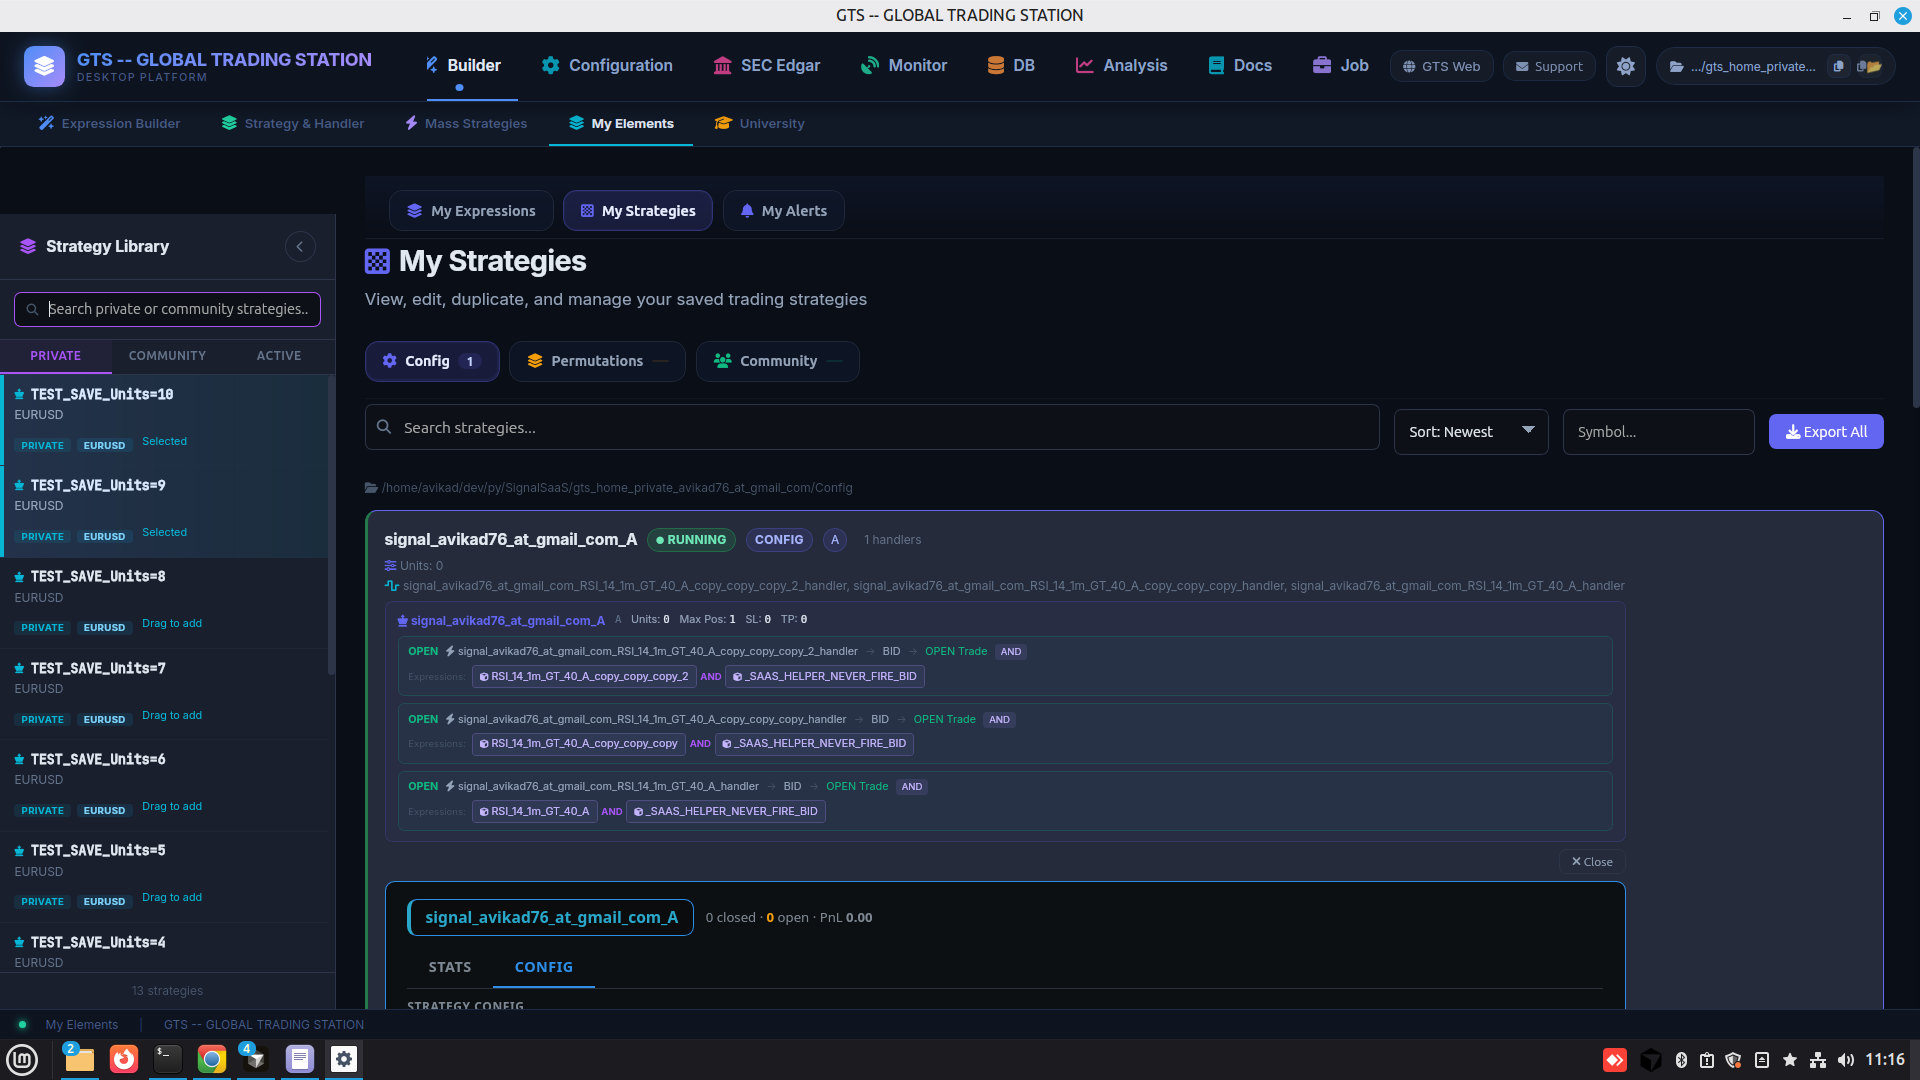
My Strategies library
My Strategies ยท saved strategies + handlers + nested expression refs with running/config/tracking badges.
Configuration / Process
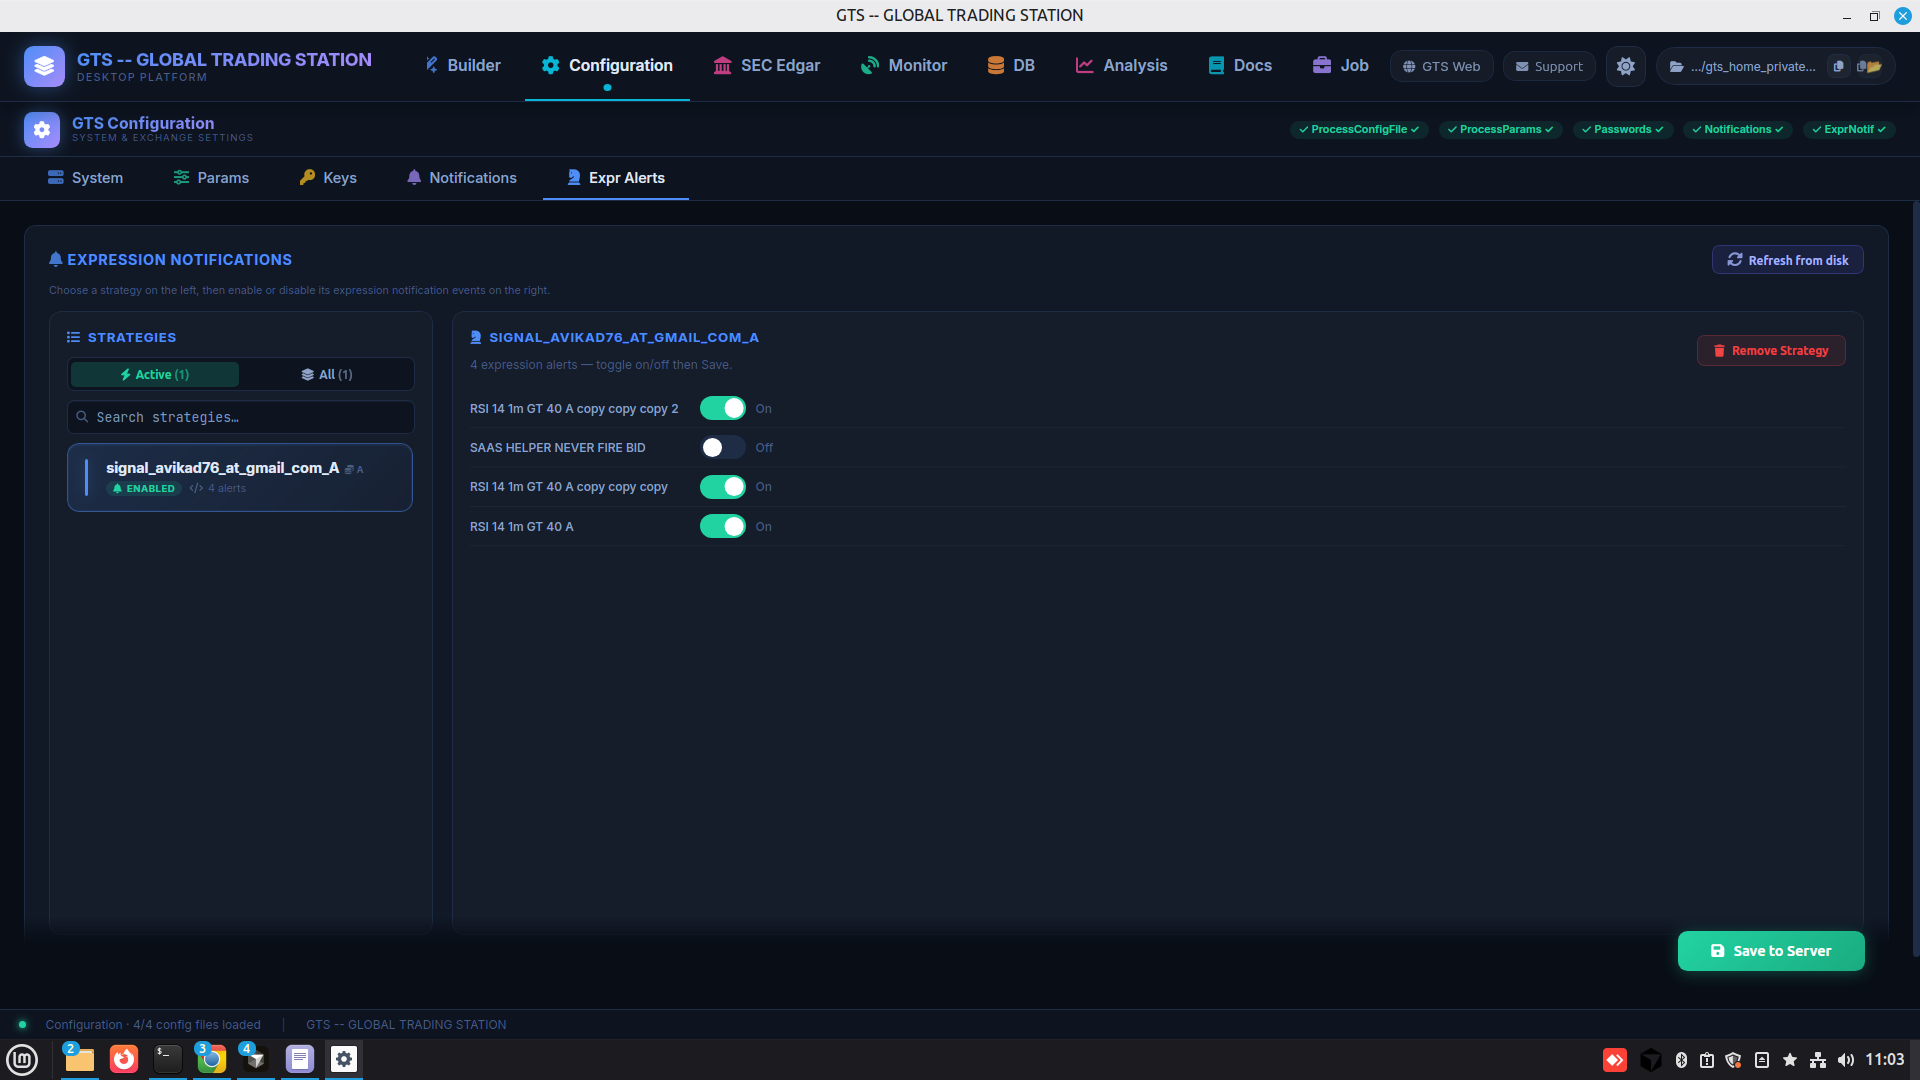
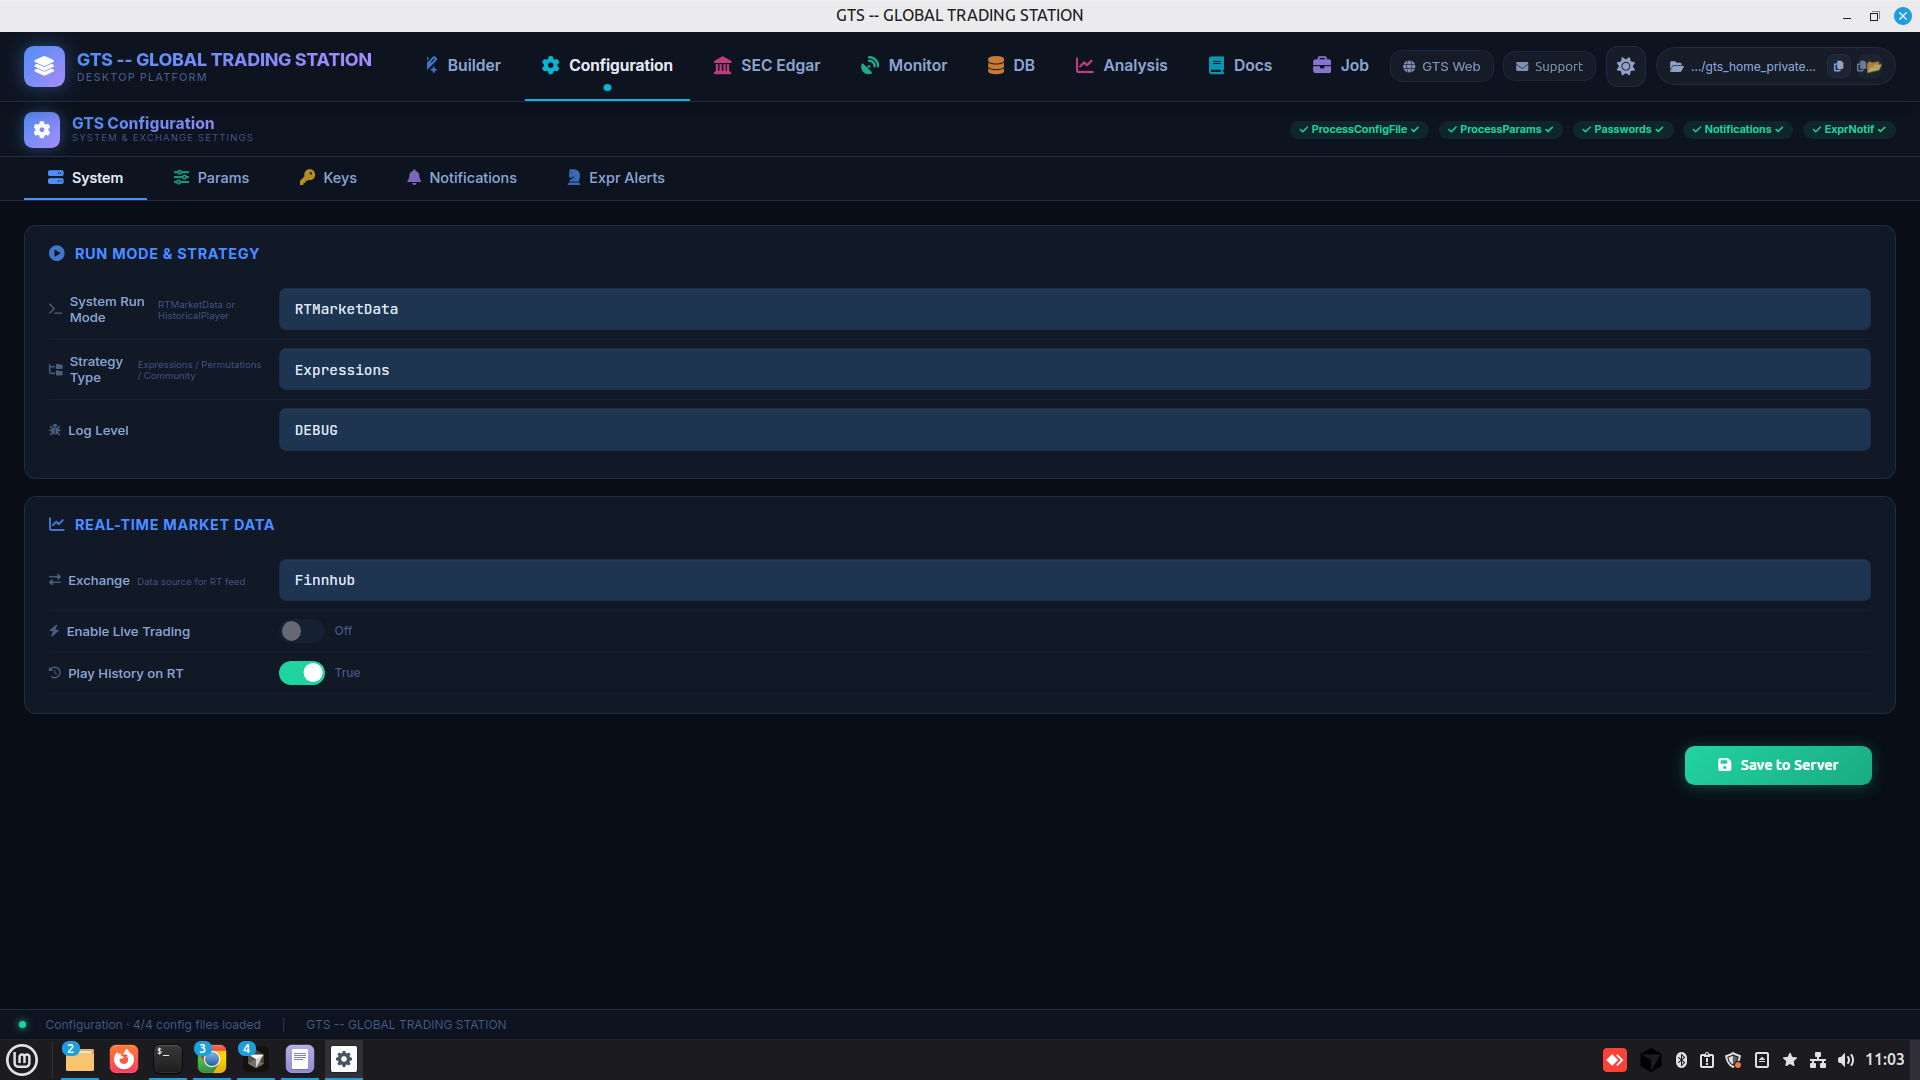
Configuration / Process ยท system & exchange settings, 5 sub-tabs (System / Params / Keys / Notifications / Expr Alerts).

Step 3 ยท Notify

Signals reach you on your terms

Self-hosted channels under your keys โ€” and per-expression routing decides which fire goes where.
BYOK Notifications
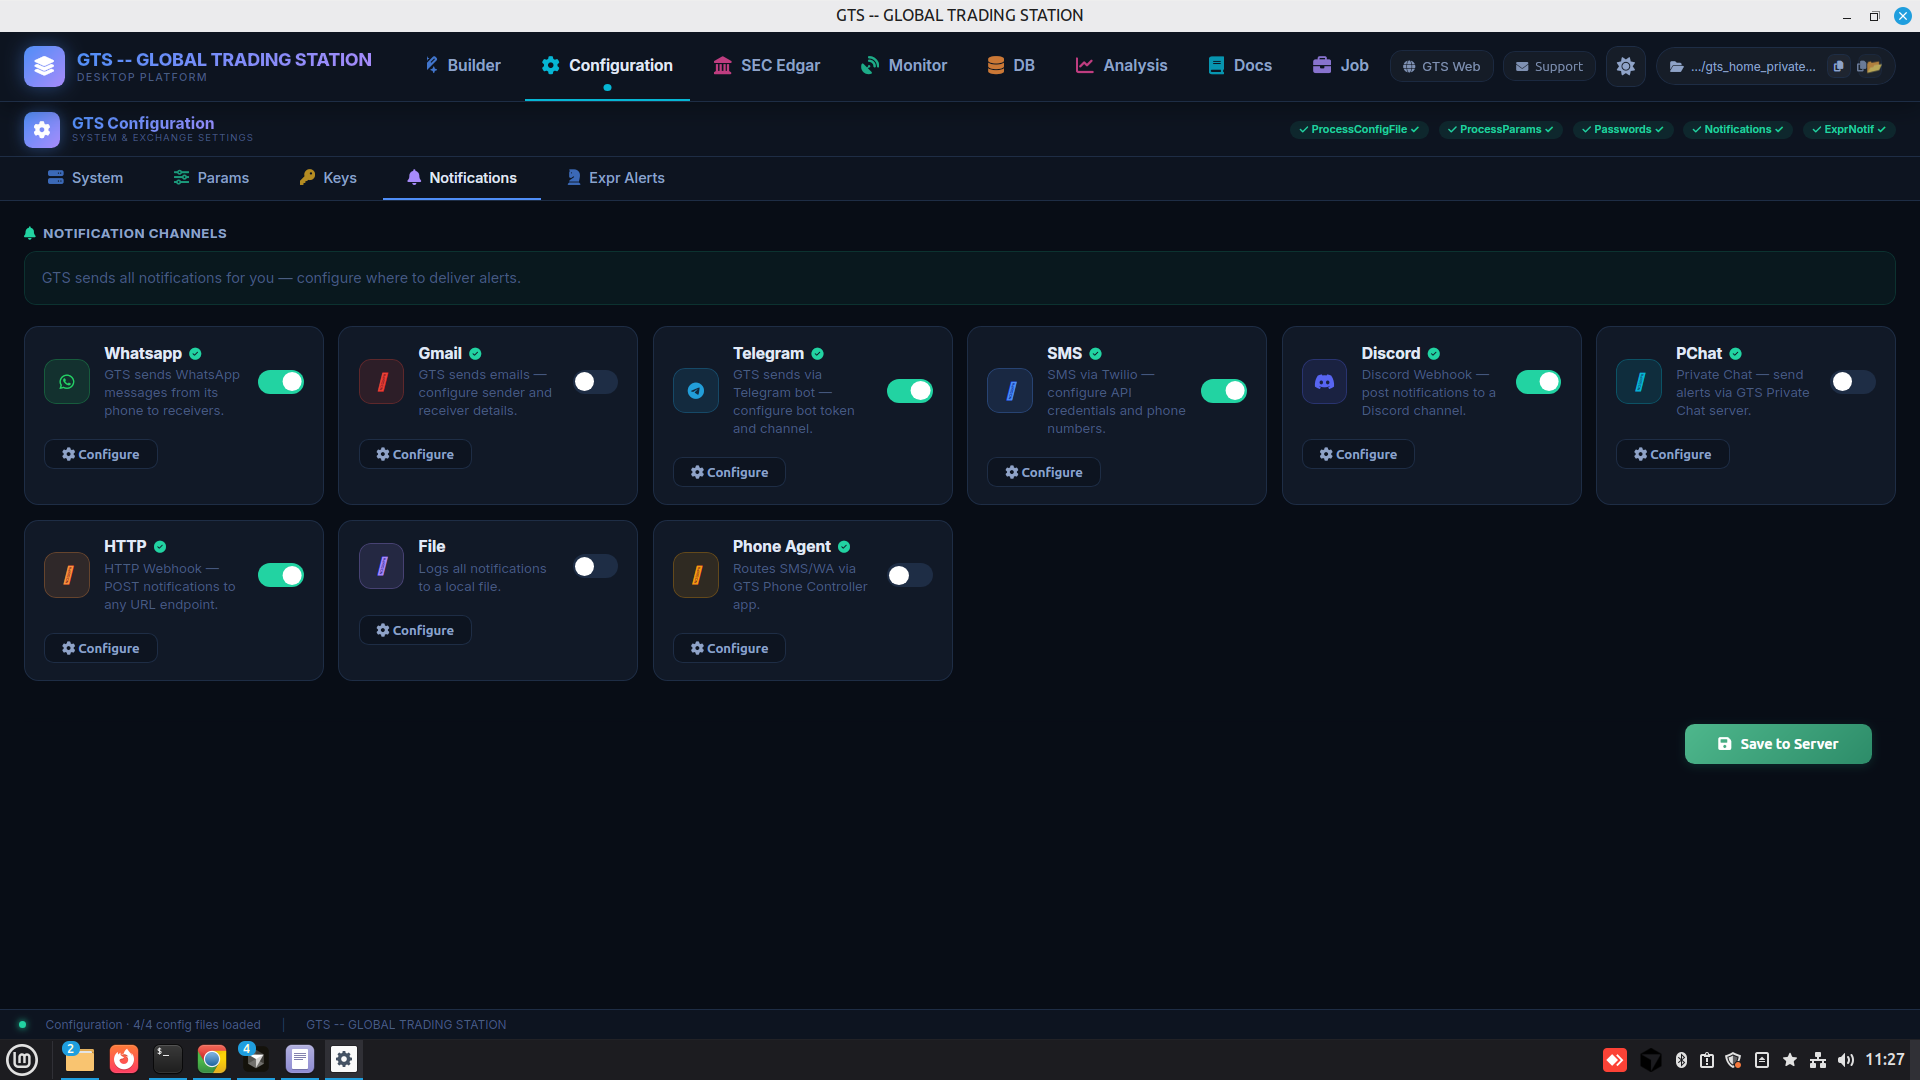
BYOK Notifications ยท 10 self-hosted channels (WhatsApp / Gmail / Telegram / SMS / Discord / WebChat / WebPush / HTTP / File / Phone Agent) โ€” your keys, no middleman.
Expression Alert wiring
Expression Alerts ยท per-expression channel routing with rule policy.

Step 4 ยท Observe

Your data, your dashboards

Native ClickHouse browser, bulk historical uploads, live account stats, and per-object engine introspection โ€” all in-station.

DB Manager
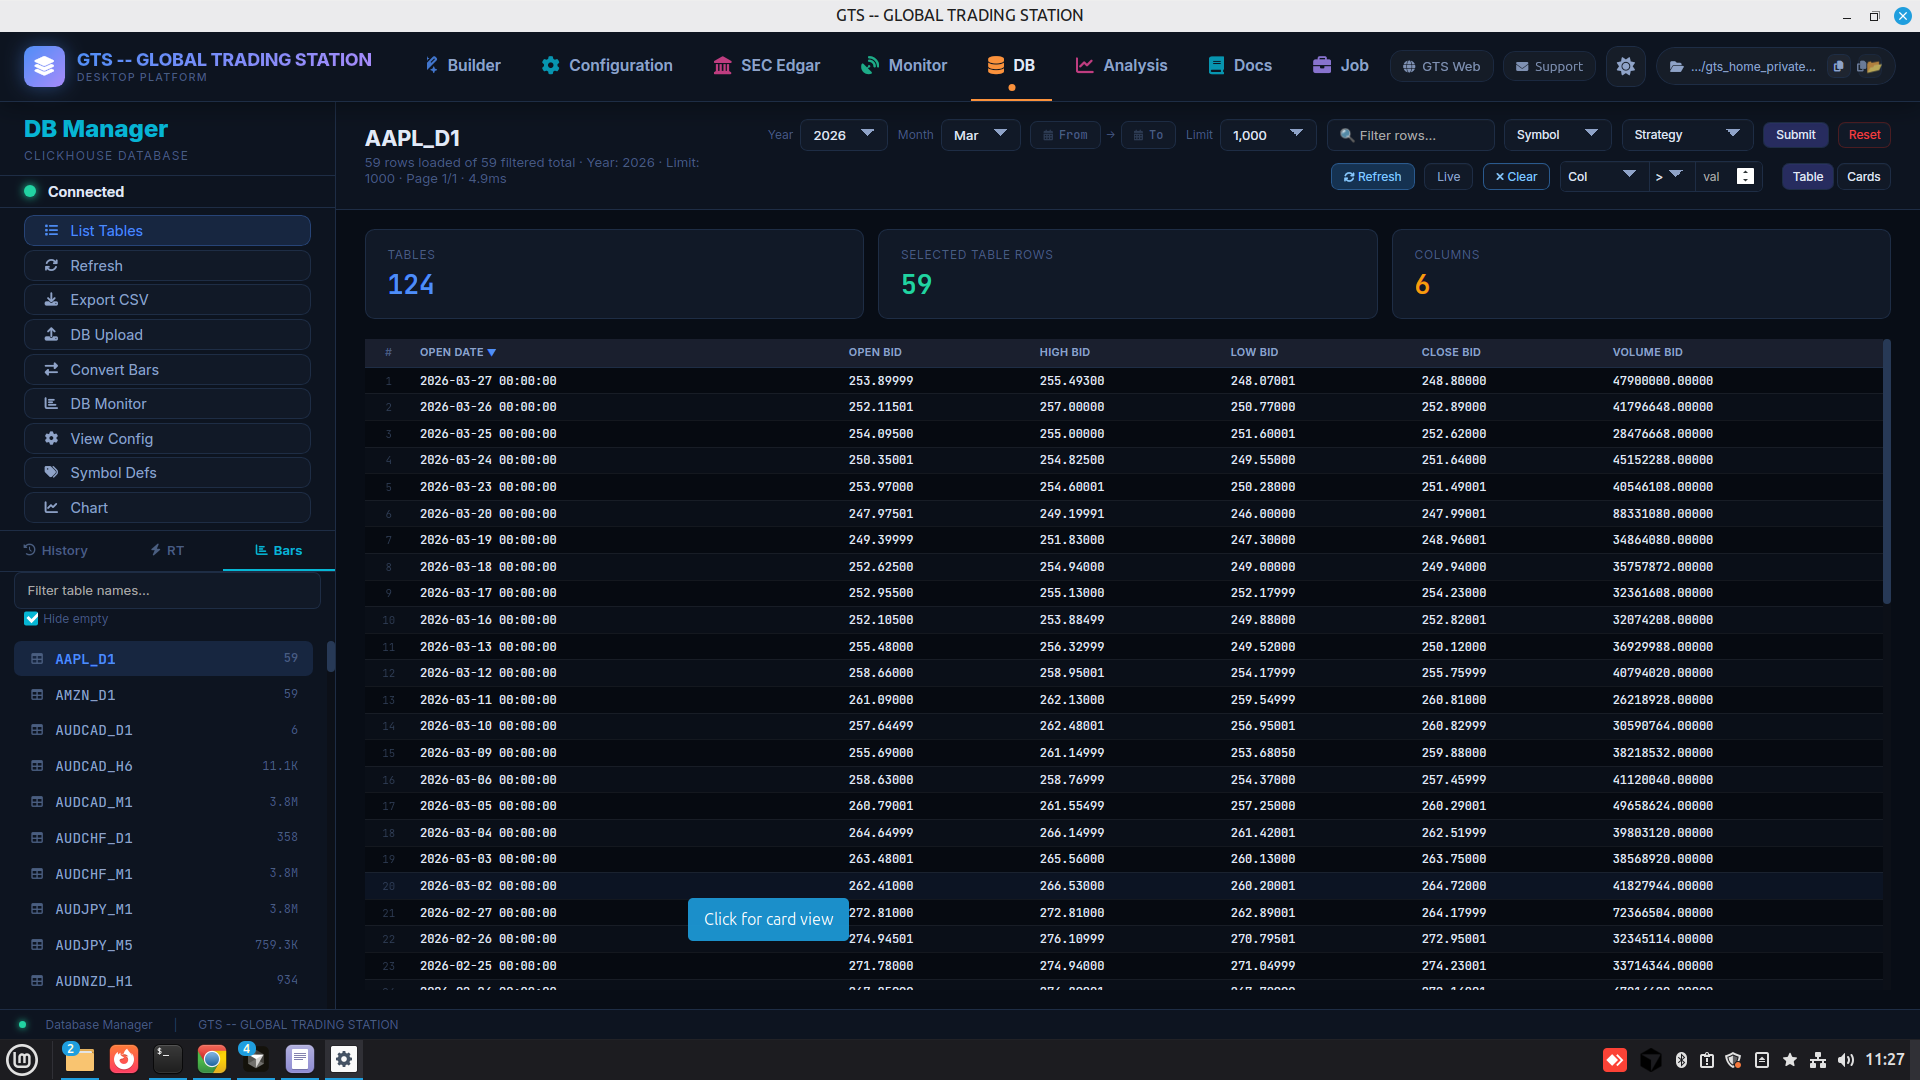
DB Manager ยท native ClickHouse browser โ€” 124 tables, per-symbol drilldowns, filters, pagination.
DB Upload
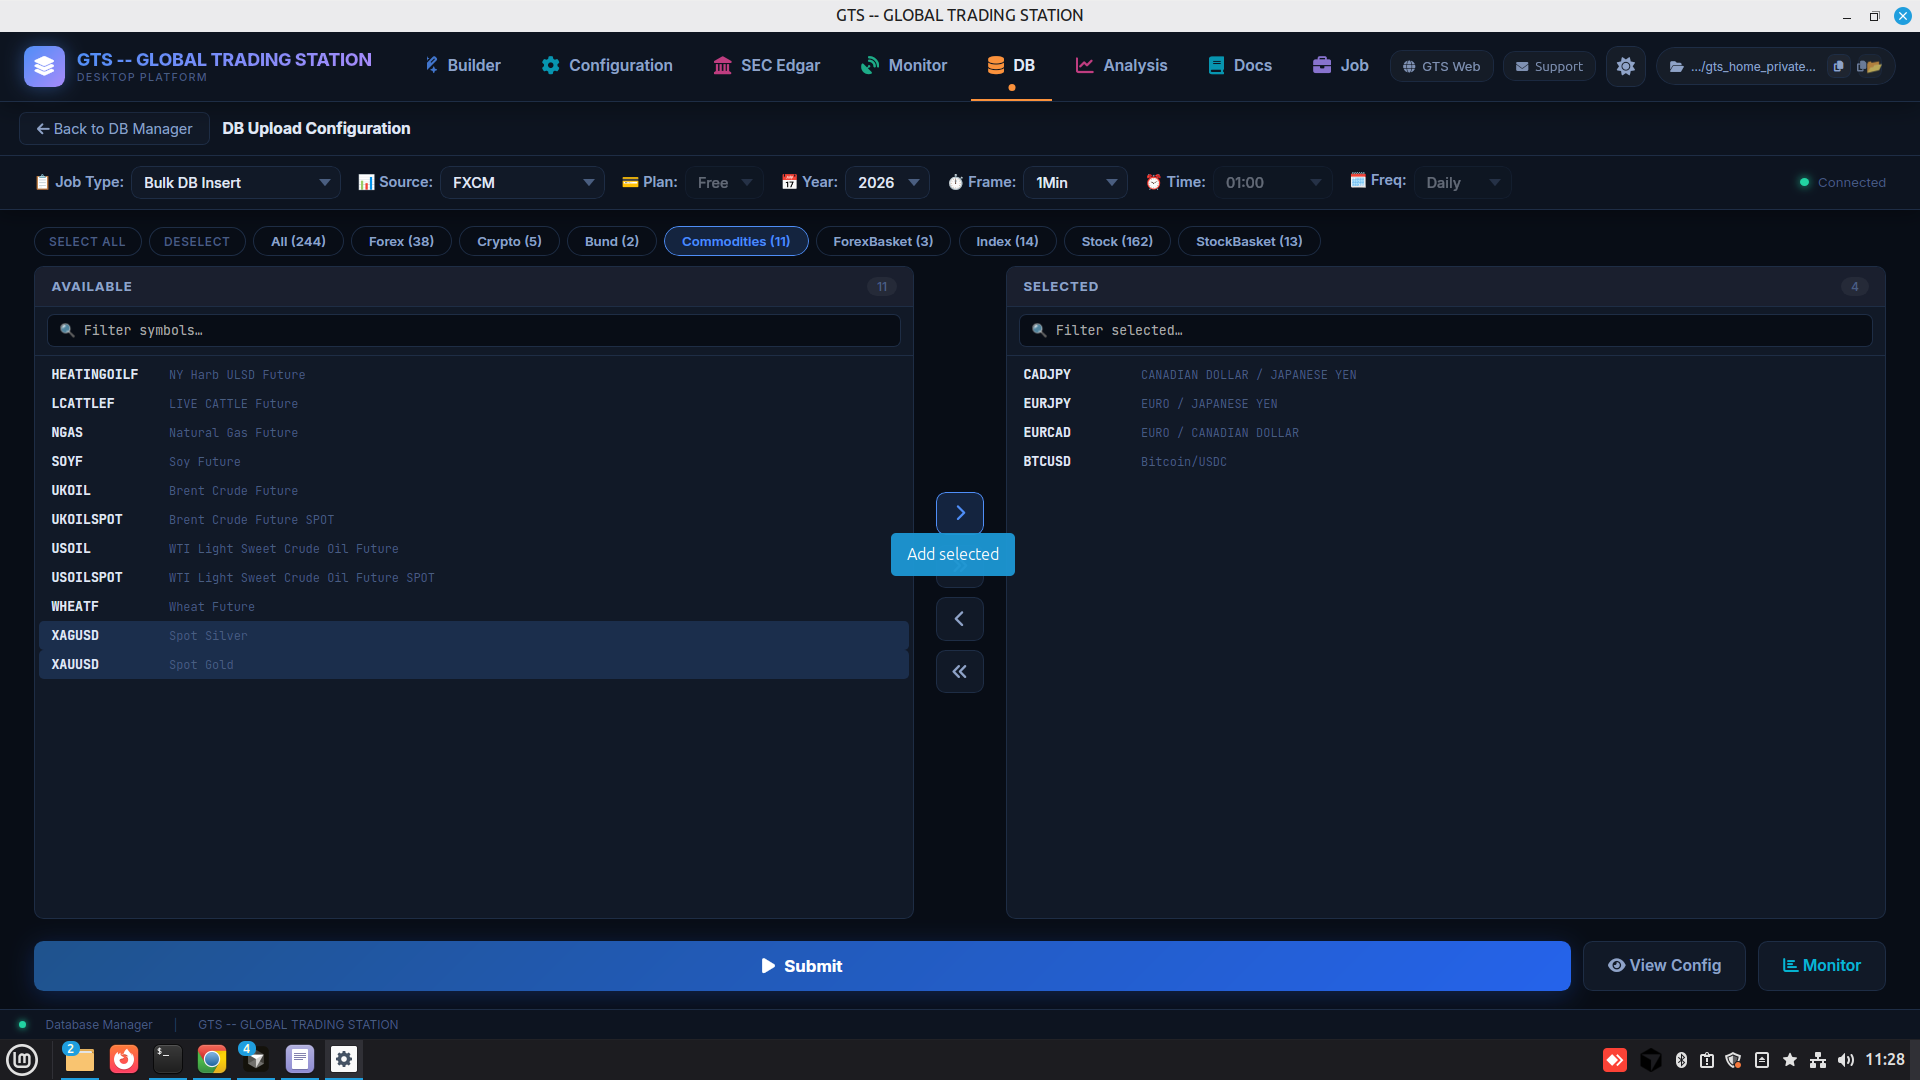
DB Upload ยท bulk historical-data jobs โ€” source ร— symbol set ร— year ร— timeframe.
DB Monitor
DB Monitor ยท live trading account stats โ€” P/L, positions, trades, per-symbol & per-strategy breakdowns.
GTS Monitor
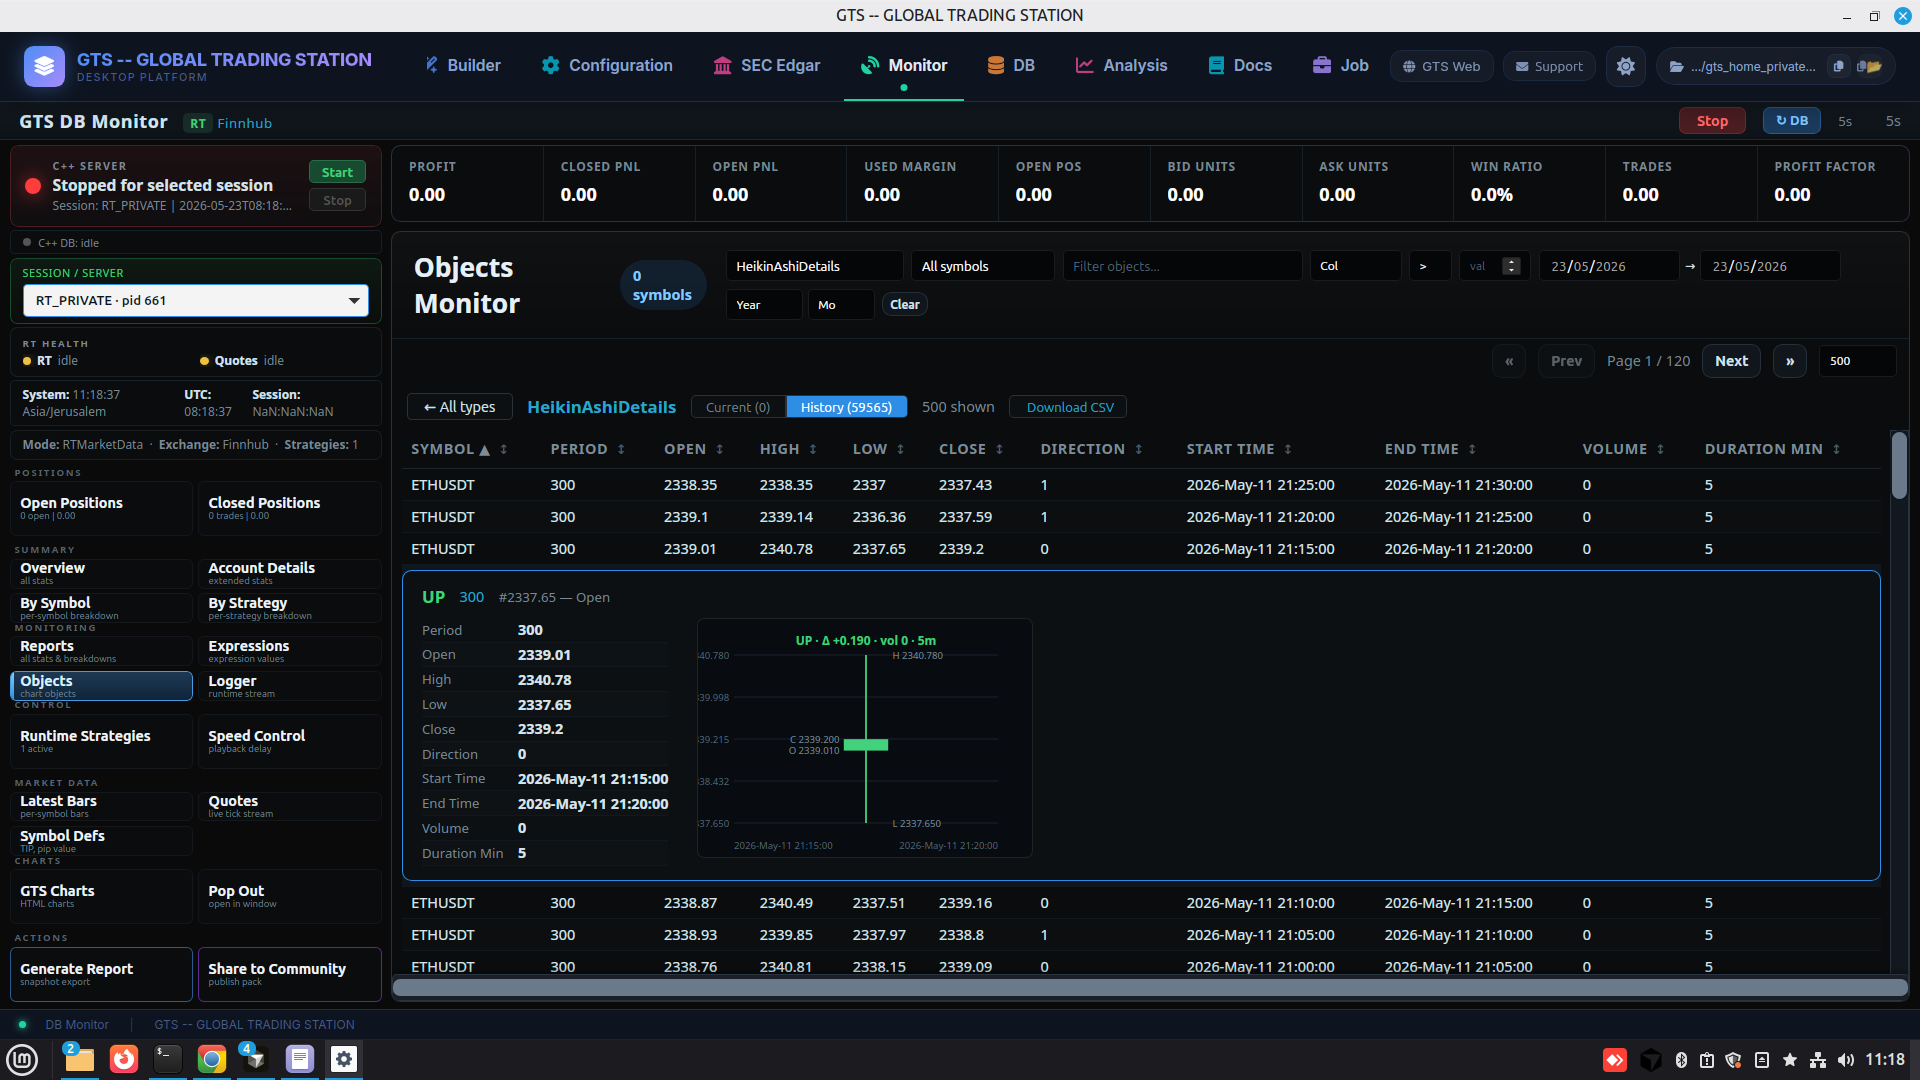
GTS Monitor ยท per-object live state (RT subs, indicator caches, downloaders) across the running engine.

Step 5 ยท Power tools

Research, docs, and AI-as-operator

Filings, embedded TradingView, offline docs, and a Job Center where every GUI action is also a job an LLM or terminal can call.
SEC Edgar
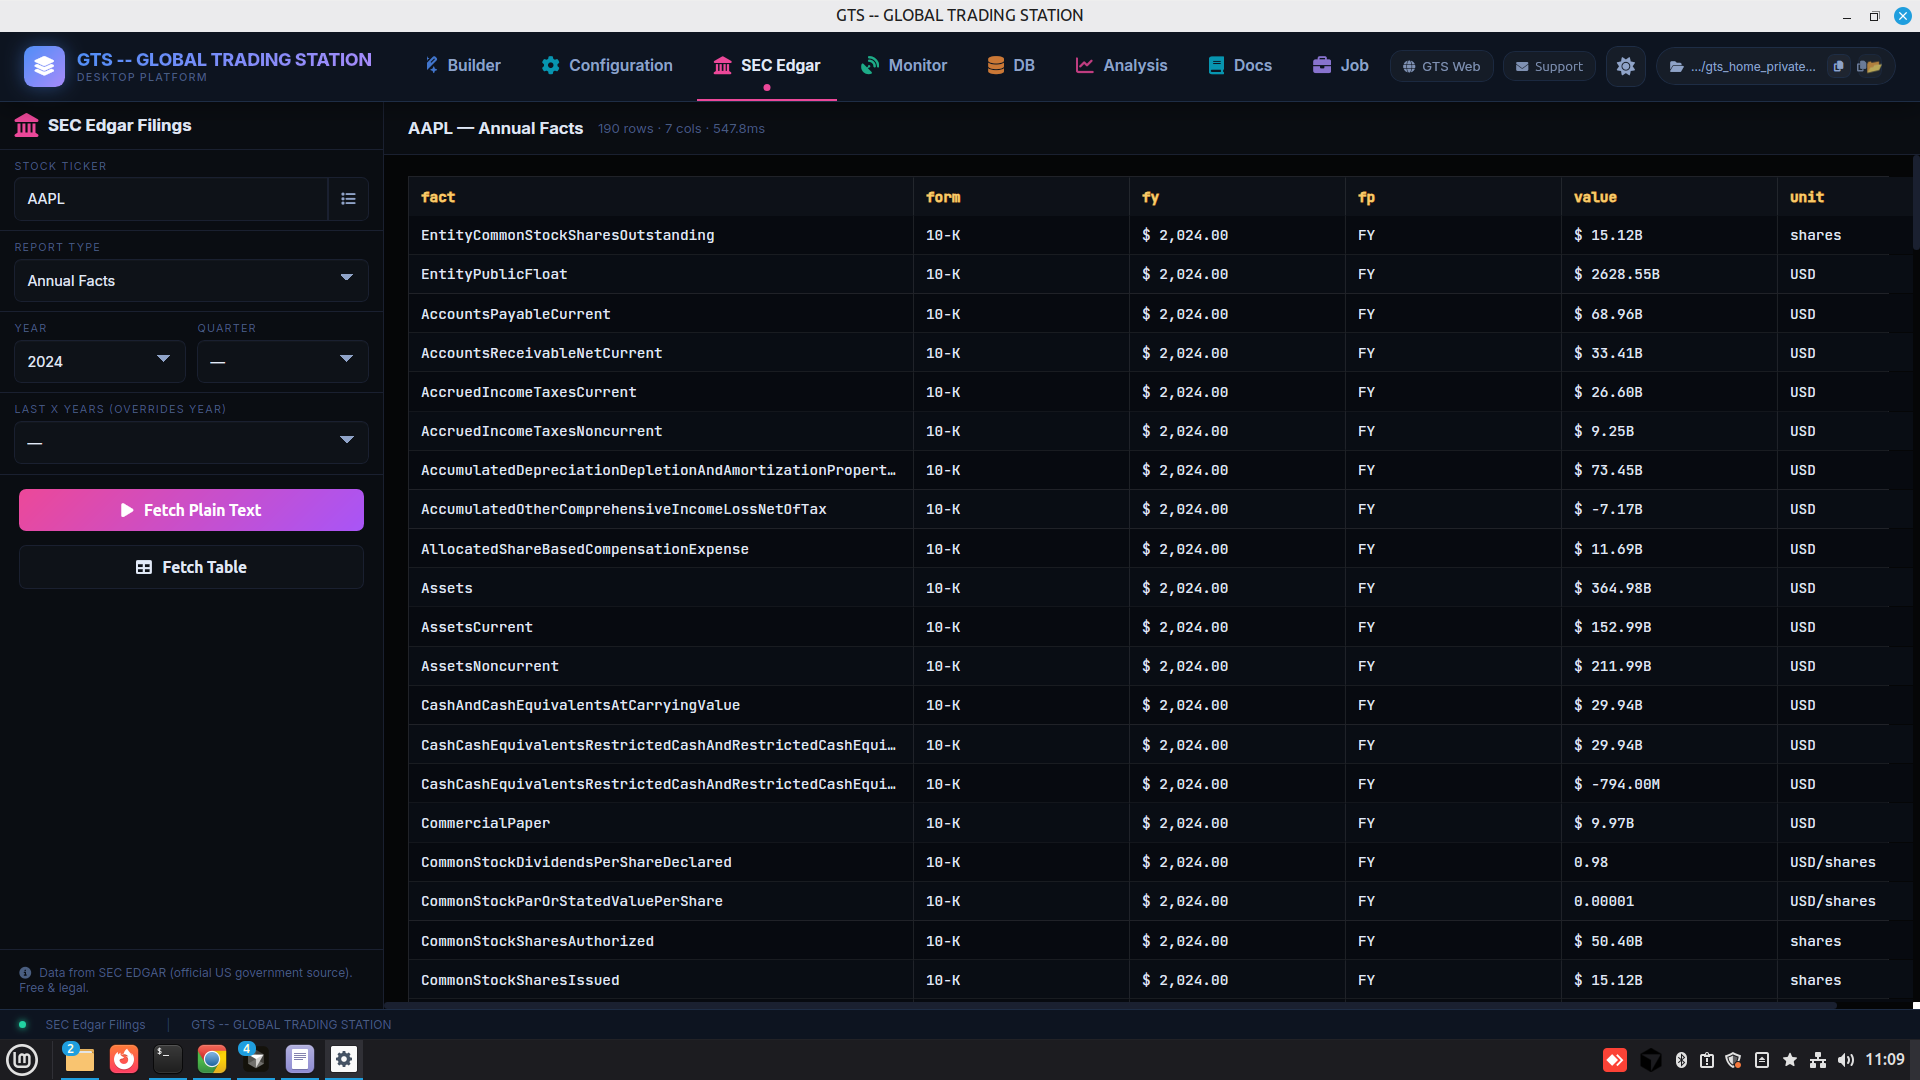
SEC Edgar ยท built-in EDGAR integration โ€” fetch every filing line-item to feed strategies as fundamentals data.
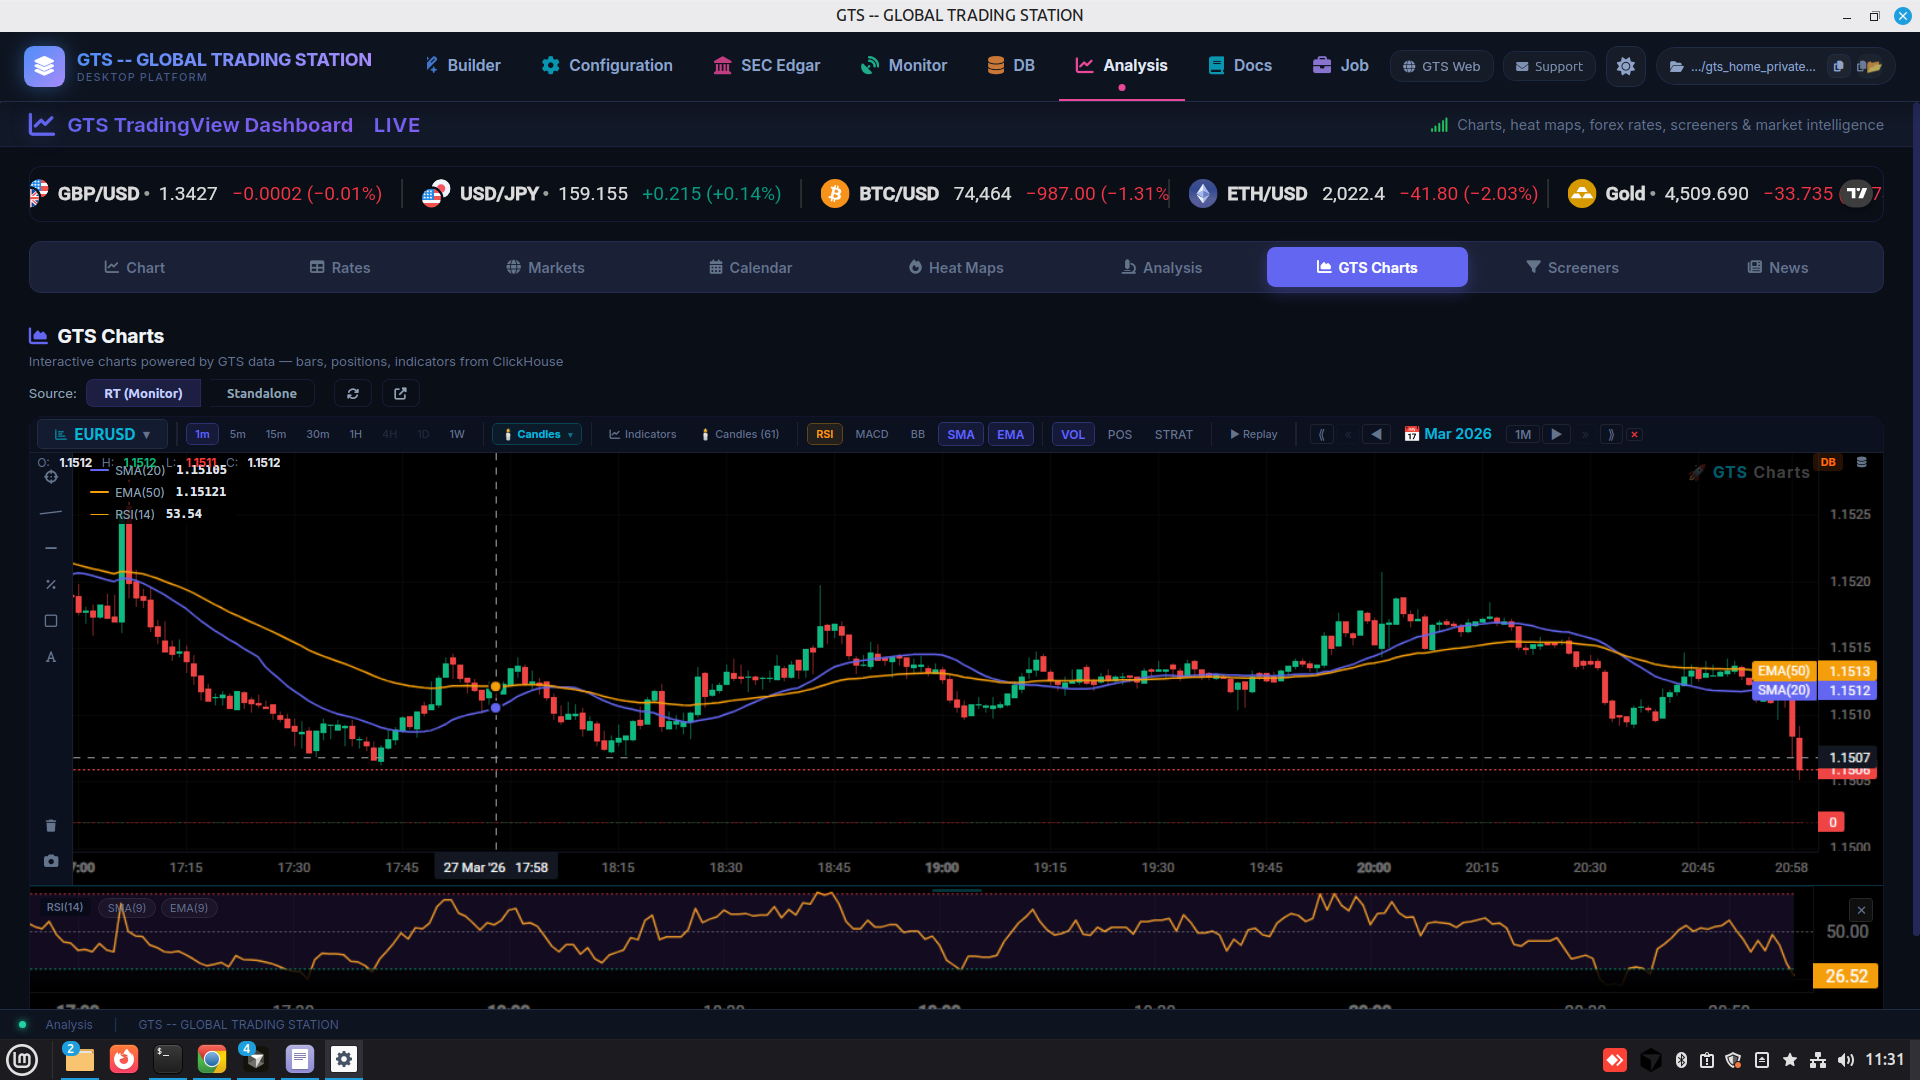
TradingView Dashboard
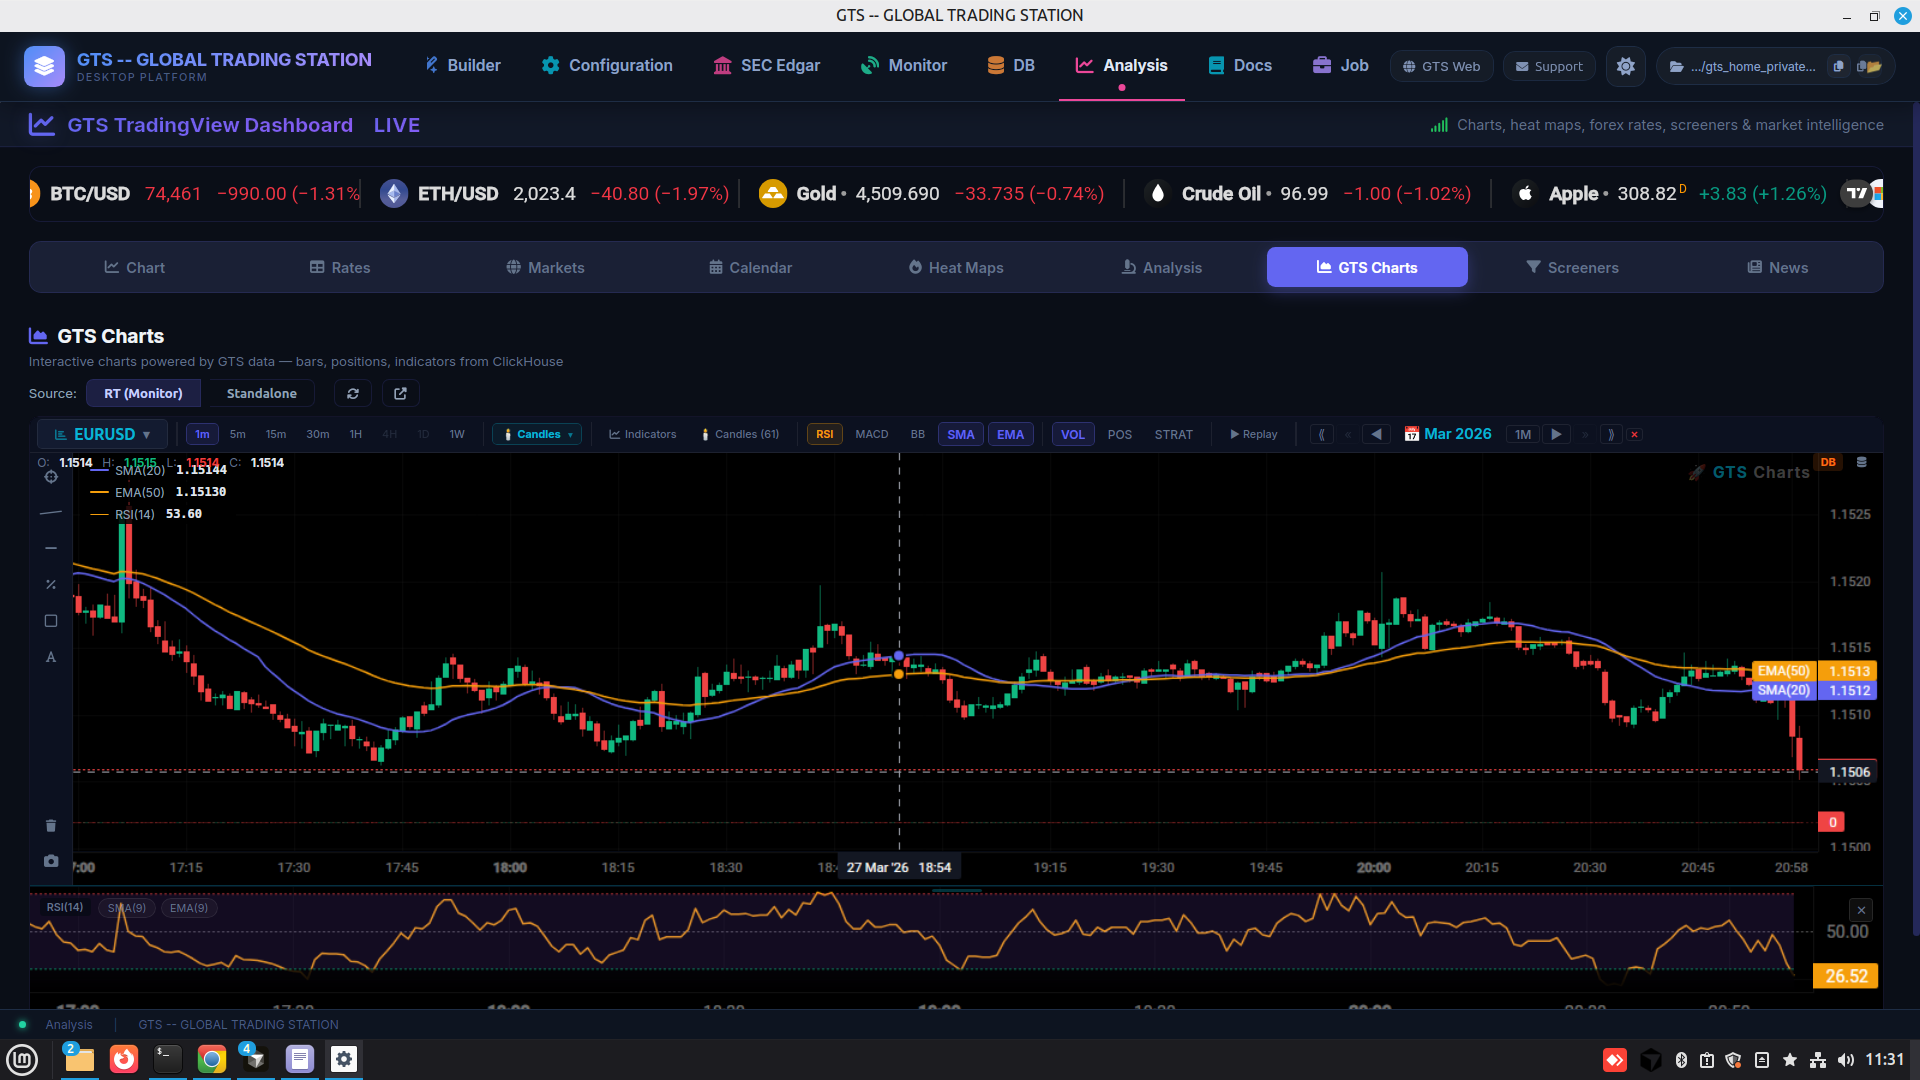
Analysis ยท embedded TradingView โ€” charts, screeners, calendars, news, heat maps inside the station.
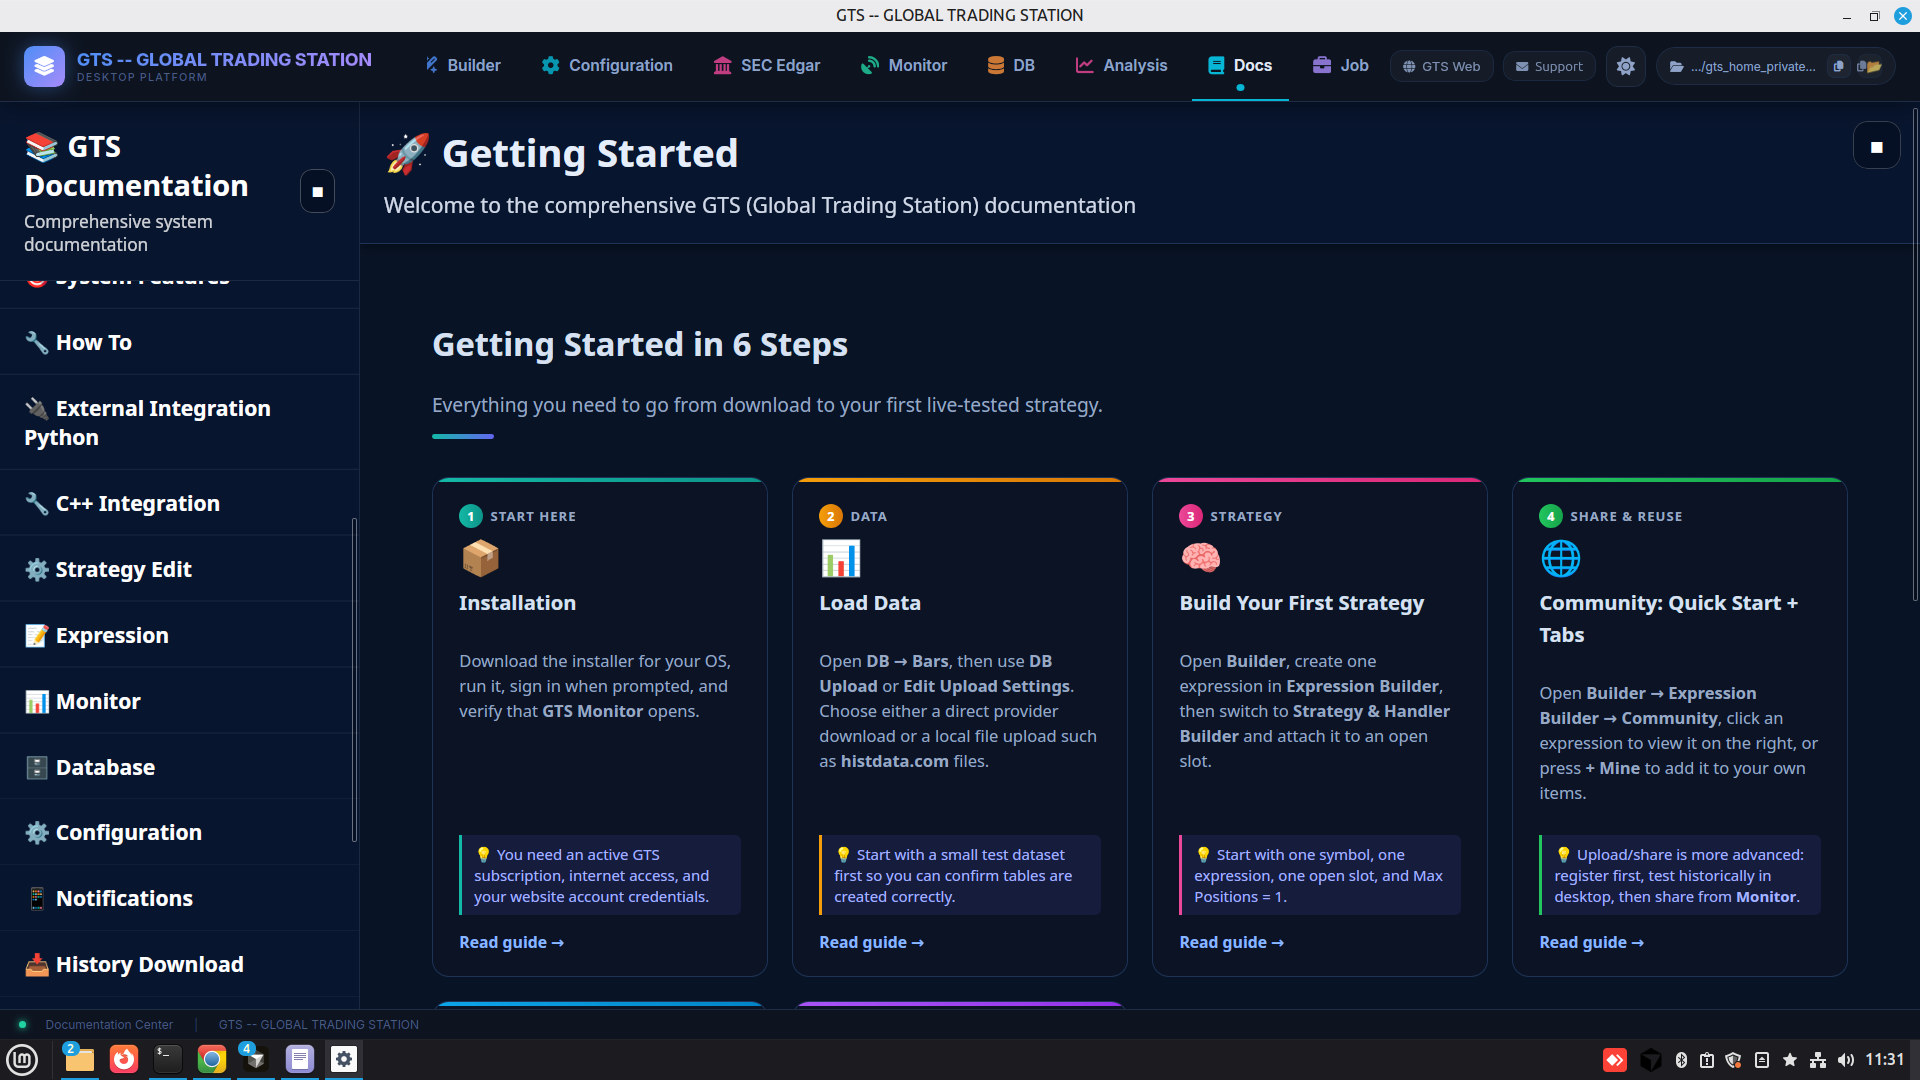
Documentation Center
Documentation ยท offline docs hub โ€” Getting Started in 6 Steps + per-topic deep dives.
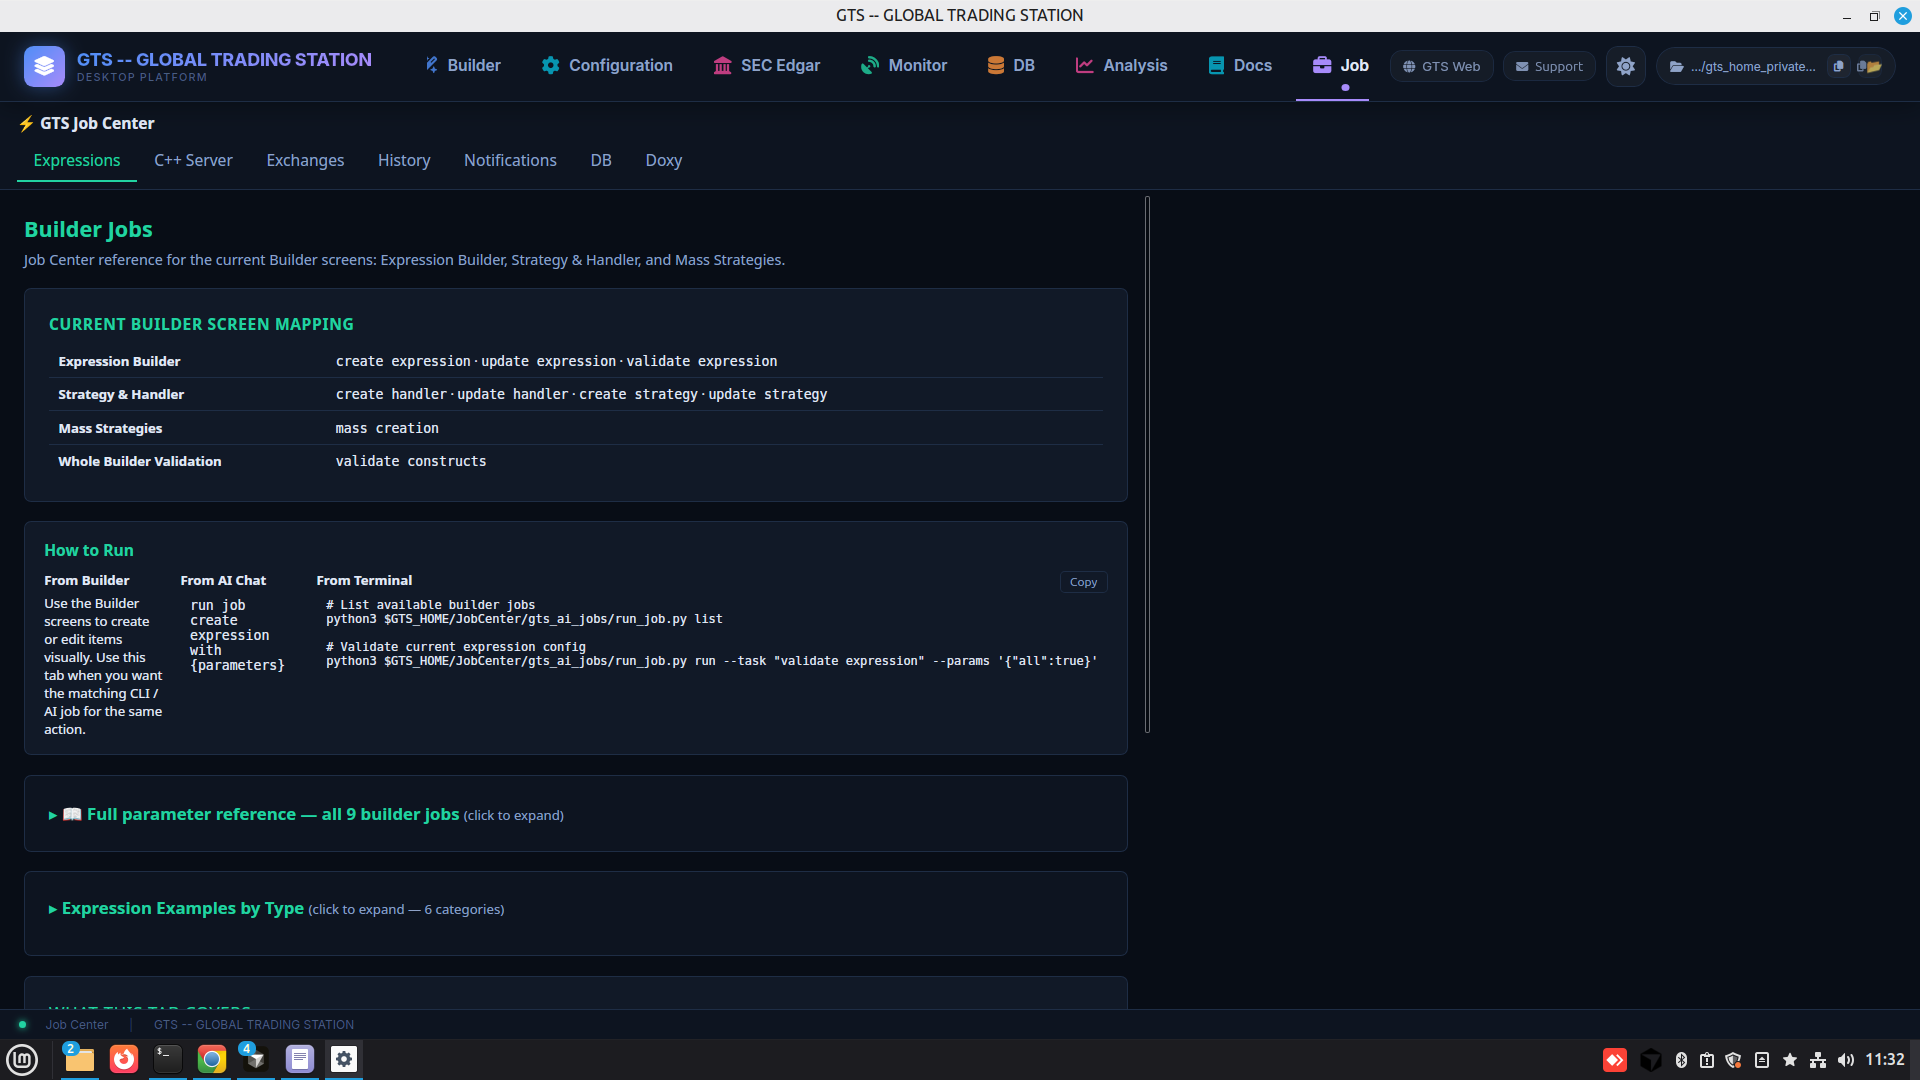
Job Center with AI integration
Job Center (AI) ยท every builder action also runnable from AI chat or terminal CLI โ€” everything in the GUI is a job an LLM can call.